
Search & investigation
Heatmaps show which area draws people, at which hour
Heatmaps from existing cameras show where people linger longest and which hours are busiest. Filter by hour to arrange shelves.
The real-world problem
Shelf layout, ad placement, shift scheduling: most of it runs on intuition. Ask which area draws the most people at which hour and no department can answer with data. Vaidio AI Vision turns camera feeds into density maps, giving operations numbers behind every layout decision.
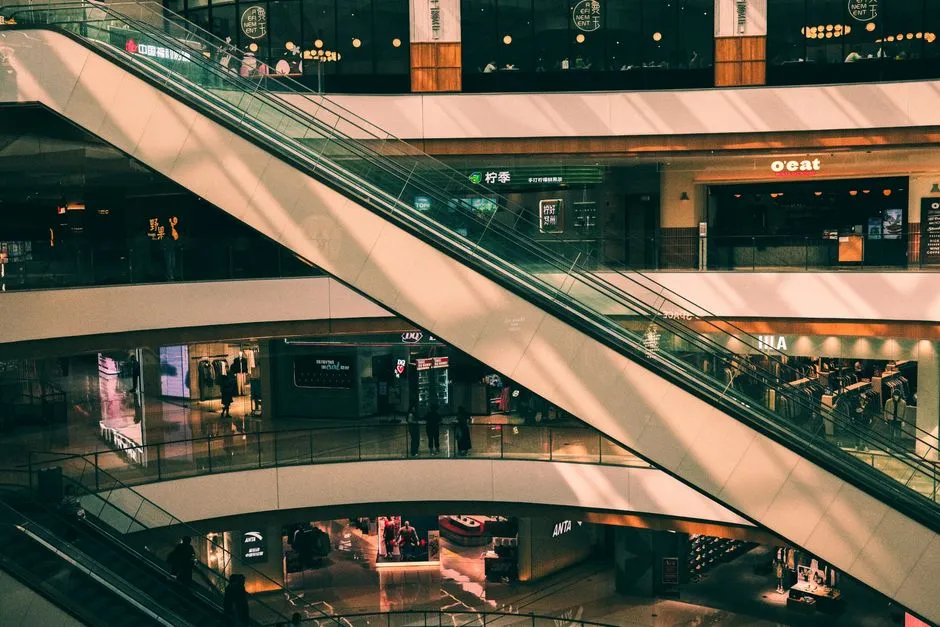
Golden zone: drinks shelf · high density
18:00-19:00 · Saturday
How it works
01
Connect existing cameras, enable the heatmap
IP cameras at stores, lobbies and grounds connect to Vaidio AI Vision and get heatmaps enabled; the camera only needs object detection running, no extra license. The map covers the camera's whole observation zone.
02
AI draws density maps by hour and object type
Colors show object density at each position in the frame. View hour by hour or merged into one image for the full 24-hour window; each view picks up to 5 object types, for example person, car, motorcycle. The longer the analyzed video (from an hour upward), the more reliably the map reflects real movement patterns.
03
Compare and decide
Contrast zones with and without advertising, before and after a shelf change. Combine with object counting and dwell time to put numbers next to the picture; set a people-count threshold to be alerted when an area gets too crowded.
Real-world applications

Retail and shopping centers
Find the golden zones for shelves, displays and ad placement from real customer density. No guessing, no gut feel.

Measuring promotions
Compare traffic and dwell around the promotion area before and after the campaign (combined with counting and dwell analytics) to judge real impact.

Staffing for peak hours
View the map hour by hour to see busy windows, then schedule shifts, open counters and move staff to gathering spots instead of spreading thin.
Security and area operations
Spot areas that regularly overcrowd to prevent pushing incidents; watch grounds activity at night through the density map.
What you get
Shelf decisions backed by real density
Density maps built from camera feeds show where people and vehicles actually gather, replacing guesswork in shelf, display and ad placement.
Before and after every change
Compare maps across two time windows to see how traffic shifts after a shelf change, a new advertisement or a rerouted walkway.
Shifts that follow busy hours
Read the map hour by hour to find gathering windows and move staff into them instead of spreading shifts evenly across the day.
Crowding spots surface early
Zones that turn dense at the same hour every day mark pushing risks; set a presence threshold in counting to be alerted when levels pass the mark.
How deployment works
Step 1
Survey the areas to measure
Pick cameras that cover the shelves, walkways and ad zones end to end; the map is only as complete as what those cameras see.
Step 2
Pick the deployment shape
Server placed at the store, mall or grounds; the number of cameras to map decides the server sizing and existing cameras stay in place.
Step 3
Connect cameras and enable heatmaps
Connect cameras over ONVIF or RTSP, enable the heatmap per camera, then choose object types to measure and the analysis window.
Step 4
Tune and operate
Pilot one aisle or one store first, check the map against real gathering patterns, adjust camera zones, then expand.
Infrastructure requirements: IP cameras from 720p, 2MP recommended, connected over ONVIF or RTSP; server placed at the store or grounds, existing cameras stay in place.
Frequently asked questions
Which object types can heatmaps measure?
Any type the AI model recognizes on the camera, for example person, car or motorcycle; each view picks up to 5. The heatmap in Vaidio Core uses one camera at a time and shows the last 24 hours per view; longer ranges are combined from the separate analytics functions.
Must people stop and face the camera to be counted?
No. The system records people as they move through the area, with no need to face the camera or pause. The map reflects natural movement flows.
What time window does the heatmap show?
Two view modes: hour by hour, or one merged image for the whole day inside a 24-hour window. Each view applies to one video source: a camera's live stream or a recorded file segment.
Are there numbers alongside the color map?
Yes, from companion features: in/out counting across a line and dwell time inside a zone. With Vaidio Data, figures are charted and exported for deeper analysis.
Where do we view the map, and can it be exported?
Heatmaps are viewed in the Vaidio web interface in a browser. Search results and heatmaps export to .xlsx for reports; combined with Vaidio Data they feed Power BI.
Related features
Put AI Vision to work in your operations
Turbo Solutions surveys your current system, demos against your real operating scenarios and quotes by scope of work. No disruption to daily operations.
Book a demo