
Centralized management
Vaidio Data: from video data to decision-making reports
Turns camera data into reports of people, vehicles and events by hour and site. Chart trends, export, connect Power BI.
The real-world problem
Cameras record all day, but answering how many customers came this week, when incidents happened or which entrance sees the most vehicles still means watching footage. Vaidio Data collects the results of every Vaidio feature and turns them into statistics and charts ready for management decisions.
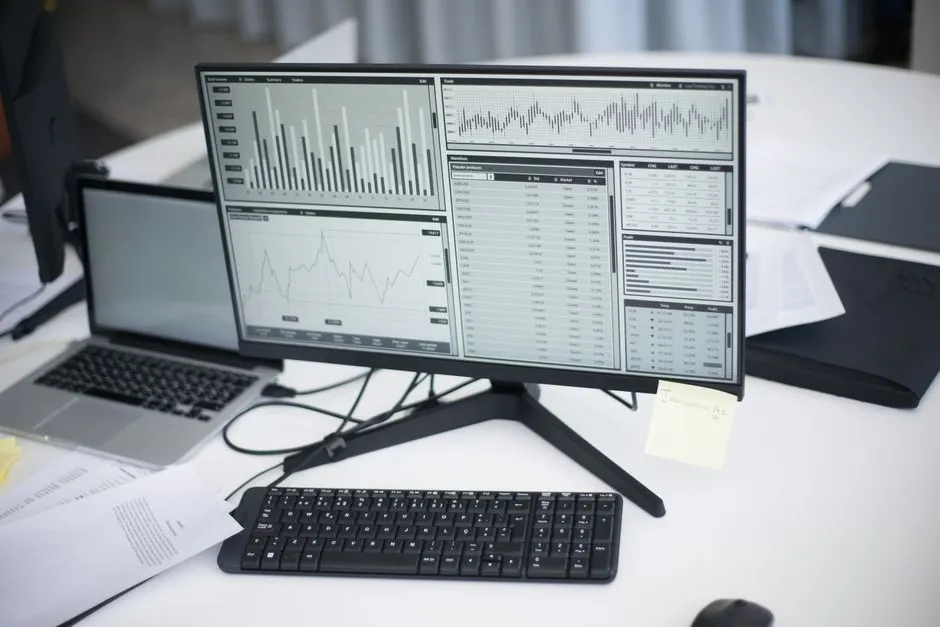
Visitors: 1,204 · +8% week over week
Whole chain · weekly comparison
How it works
01
Gathers metadata from Vaidio Core servers
Vaidio Data connects to the Vaidio Core servers inside the business network and automatically collects feature results: alerts, dwell times, face and plate recognitions, counting data.
02
Multi-condition reporting
Filter by time range (recent hours, day, month, year or custom; grouped hourly or per 15 minutes), camera, object type and alert type; results view as lists or charts with automatic period-over-period comparison.
03
Charts on the spot, ready for management reports
Results draw as charts right in the interface: KPI, line, bar, stacked, combined, pie/donut, time heatmap and box plot; download as images or data for board decks. Exports to .xlsx, and with the API (from version 9.1) feeds Power BI for deeper analysis.
Real-world applications

Retail
Customer traffic by hour and by store; dwell by area, feeding shift and display decisions.

Parking lots and garages
Vehicle volumes by class and hour; peak statistics for capacity planning.

Industrial parks
Entry counts of people and contractor vehicles; alert statistics per zone for safety reviews.

Healthcare
Waiting-room occupancy by hour; incident timeline for quality reviews.

Queues and service counters
Wait-time statistics by counter and hour to justify opening more positions.
What you get
Numbers instead of tape review
Recognition results already in the system are gathered in one place and turned into statistics by hour, by site and by event type.
This period against the last, on the chart
Line and bar charts compare against the previous period, each chart with its own filter by camera, object type and list.
Reports reaching the right people on schedule
Dashboards download as PNG images for reports, export data to Excel, and email out daily, weekly or monthly on schedule.
Deeper analysis through Power BI
Data connects to Power BI for further internal analysis; the API pulls hourly or daily figures into internal systems.
How deployment works
Step 1
Connect the Vaidio Core servers
Vaidio Data collects feature results from Core servers on the same network; decide which servers join before installing.
Step 2
Pick metrics and set up dashboards
Filter by time range, camera, object type and alert type; set Normal, Busy, Overloaded thresholds for queues and occupancy.
Step 3
Fold reports into management routines
Schedule dashboard emails by day, week or month; download dashboards as images or Excel data to drop into internal reports.
Step 4
Connect Power BI and internal systems
From version 9.1, the API pulls hourly or daily data to feed Power BI and internal analysis systems.
Infrastructure requirements: Vaidio Data gathers data from Vaidio Core servers inside the business network, API available from version 9.1; current cameras and servers stay, with figures flowing into Power BI and internal Excel reports.
Frequently asked questions
Can Vaidio Data look up plate images again?
No. Vaidio Data works with statistics and charts from collected metadata; image lookup stays in the Vaidio Core search at each site.
Does it aggregate data across locations?
Yes. Connect multiple Vaidio Core servers and report across every site in one view.
Can reports be exported, and in what format?
Charts download as images or data, and full result tables export to .xlsx.
Are scheduled automatic reports available?
Yes, reports can be scheduled to run and send automatically on a period you set.
Can raw data be pulled into other systems?
Yes, through the API (from version 9.1), including direct Power BI connections for custom dashboards.
Related features
Put AI Vision to work in your operations
Turbo Solutions surveys your current system, demos against your real operating scenarios and quotes by scope of work. No disruption to daily operations.
Book a demo